The Crude Situation II: What does the Strait of Hormuz Disruption Possibly Tells Us About Oil’s Prevailing Economics
The Latest Oil Price Mystery
In early 2018, I wrote about the prevailing crude oil price situation that had seen their highest oil prices since 2014 at the time. The motivation for writing on this at that time was that this increase felt rather mysterious in the wake of 2014-15 period where the explosion in US Shale had introduced a new lever to global oil supply that structurally changed the landscape. The mechanism that was expected to operate going forward was that higher global prices encouraged more shale production whose increase in supply would in turn suppress prices even in the wake of OPECs response at the time to increase supply even further in order to drive down prices and thereby maintain market share from this shale industry. The market soon discovered this shale production to be more resilient than anticipated. Ironically some of the reasons cited for high prices in that article involve the same key stakeholders today given that at the time, the US was looking at pulling out of the 2015 Joint Comprehensive Plan of Action (JCPOA) agreement with Iran which it then did on May 8th 2018 thereby making the market anticipate lower supply.
Today’s situation presents a similar mystery to me. As extensively documented in the last 3 months, the confrontation has led to the closure of the Strait of Hormuz which has caused higher oil prices to reverberate across the globe. This is no surprise given the much publicised and quoted statistics that normally, about 15mbbl /35% of the worlds seaborne traded oil (i.e ~15% of total production) makes its way out via the Strait .
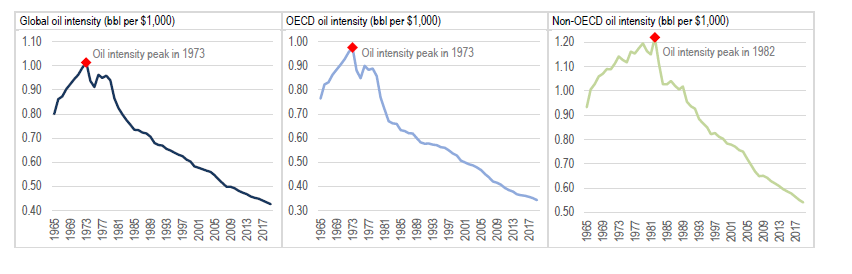
What I do find surprising though is that given the seemingly likely lack of short term resolution to the conflict or at least the opening of the Straits, why are prices today of around ~$95/bbl Brent i.e. ~30% higher than average pre-war levels, not even higher? For sure there are factors such as that while the Straits are effectively closed, not the full 15% of global oil is completely lost. An estimated 3.5 to 5.5 mb/d or so can be theoretically diverted via alternative routes through Saudi Arabia’s pipeline to the Red Sea and via the UAE’s pipeline to the port of Fujairah. Furthermore, predictive humility tells us that the oil price discovery process is always evolving and contingent on new foundations and contexts so one cannot always lean on previous spikes to derive new expectations. As an example, we can look at the Oil GDP intensity trend. The world has progressively used less oil to create a unit of GDP as shown in figure below from Ruhl and Eker’s Harvard Kennedy School Review paper Oil Intensity: The curious relationship between oil and GDP. Therefore, we cannot always proxy prior crises to new crises.
With that being said however, the most recent conflict to affect oil prices drastically was the Russia-Ukraine conflict in 2022 which saw a year on year average increase on Brent from ~$72 to ~$100/bbl and peak of $139/bbl in March 2022 i.e. ~42% year average and 96% peak increase on a global oil supply base of Russia’s share of ~11% of global production. It took the better part of a year before prices normalised, as markets scrambled to reroute Russian barrels and rebuild supply chains.
So the basic mystery is - if Russia Ukraine had such a huge impact on a lower supply contribution - why is the current conflicts’ impact comparably lower as at today as the crises seems to drag further? The disclaimer here being the “as at today” in the previous statement as we know this can change as I write this on the 9th of June 2026. If we look at peak prices only, then the figures are comparable with the current crisis’ peak of about $138/bbl i.e.~92%. Further more, the post conflict period average price being more around ~$103-105/bbl reflects a 43-46% average increase which speaks to a more comparable expectation. However, the main discussion point here is more around the current trend towards lower prices while Strait remains closed.
There are 2 potential hypothesis worth considering in explaining this dynamic. Note, this is not exhaustive as there are always significant on the ground complexities when postulating on oil prices.
There was a structural under-estimation of how much oil supply is now available outside the Middle East
The Market is over-optimistic regarding the resolution of the conflict
Hypothesis One — The world has more oil than we thought
The first hypothesis is structural. It is possible that the world has systematically underestimated how much oil can be produced outside the Middle East, and that we are now in the process of discovering this true ceiling through the experience of sustained lower than expected prices. A period such as being experienced now provides an ideal natural experiment for this because the high prices incentivise producers to maximise their output especially if they are not part of OPEC and therefore not answerable to a price supporting co-ordination mechanism.
Consider the trajectory of a few key non-OPEC producers over recent years.
Guyana is perhaps the most dramatic illustration. By late 2025, Guyana was producing approximately 900,000 barrels per day — up from roughly 120,000 bpd in 2020. That is an almost eightfold increase in five years from a country that, not long ago, was a net energy importer. By early 2026 the figure had crossed 926,000 bpd, with capacity on track for 1.7 million bpd by 2030 across eight planned offshore developments. This is not a marginal contributor — this is a country rapidly becoming a material force in global light sweet crude markets.
Brazil tells a similar, if less telescoped, story. By January 2026, Brazil’s crude production had climbed to 3.95 million barrels per day — a 14.6% increase year-on-year — powered almost entirely by its pre-salt ultra-deepwater fields, which had been written off as technically and economically marginal by many industry observers when first identified. The Búzios field alone now hosts eight FPSOs and an installed capacity approaching 1.33 million bpd. Petrobras is investing $109 billion through to 2030 with explicit ambitions to become the world’s fourth largest producer by end of decade.
The United States, meanwhile, has set new annual production records for three consecutive years, reaching 13.6 million barrels per day in 2025 — and did so with 5% fewer active rigs than the prior year. That last detail is quietly significant. Shale producers are generating more output per dollar invested through efficiency gains — longer laterals, improved fracking techniques, better data analytics — in what amounts to a structural decoupling of production growth from drilling activity. The old assumption that higher prices were required to sustain or grow US shale output is being steadily revised.
The cumulative picture is one where each of these producers has, in their own way, surprised to the upside — consistently outperforming prior capacity estimates. When you aggregate those surprises, the implication is not merely that supply was higher than expected in any given period. The deeper implication is that the global oil supply ceiling itself is higher than the consensus believed, and that price signals at current levels are insufficient to constrain production. Low than expected prices, in this reading, are not suppressing supply — they are revealing it.
Hypothesis Two — The futures price and the physical barrel are telling different stories
The second hypothesis sits at the level of market structure rather than physical supply. It concerns a divergence that has potentially been underappreciated in public commentary: the spread between the quoted futures price — which is what appears on news tickers and informs the headlines — and the price at which physical barrels of crude are actually changing hands.
To make this concrete, it helps to compare like with like — the same crude oil, priced two different ways. Brent is the world’s most widely used oil benchmark and it exists in two forms: Dated Brent, which is the price for a physical cargo ready for delivery in the near term, and ICE Brent futures, which is what trades on the exchange and appears on news tickers. In normal market conditions, the gap between the two is negligible. During the initial height of the Hormuz crisis however, significant divergence occured.
Through late March and early April 2026, Dated Brent physical cargoes were trading in the $130–150 per barrel range, while ICE Brent futures remained in the $90–115 range — a spread of $30–50 per barrel between the same crude oil in two different forms. The physical market, where actual barrels change hands, was pricing the supply shock with full force. The futures market, where financial contracts trade, was pricing something considerably more optimistic.
There are two ways to read this divergence. The first is that the futures market was simply too optimistic — that paper traders, reacting to diplomatic signals and ceasefire speculation, were systematically discounting the physical tightness that buyers of actual barrels were experiencing. The second, and perhaps more interesting, reading is that futures markets had already absorbed the structural supply story outlined in Hypothesis One. That is, the market’s relatively measured response — even as the Strait of Hormuz was effectively closed — reflects a view that non-Middle Eastern supply can absorb a meaningful portion of any Gulf disruption. If that is the case, the physical premium and the futures discount are not contradicting each other. They are representing two different things: the immediate, local cost of the crisis, and the global market’s longer-term assessment of how replaceable Middle Eastern barrels have become.
The EIA’s May 2026 forecast is consistent with this interpretation. Even after absorbing an estimated after bypass routes volume of 9-10 million barrels per day of shut-in Gulf production in April, the agency projected Brent would drop to an average of $89 in Q4 2026 and $79 in 2027 — suggesting that the structural supply base underpinning markets is robust enough to anticipate price normalization even before the strait fully reopens.
Conclusion
The current disruption involves a comparable net share of global production as Russia-Ukraine and has produced a similar aggregate premium, but the market is pricing a much faster resolution. Futures contracts dated six months out are already below $90. That confidence in rapid normalisation — while the Strait is still effectively closed — is either a sign that the structural supply thesis is correct and markets are rationally pricing in non-Gulf buffer capacity, or it is the market underpricing geopolitical risk thereby discounting a risk that has not actually gone away.
This general hypothesis testing is not devoid of limitations in light of the emphasized complexity of the global oil system. Also, while Brazil and Guyana are impressive growth stories, their crude grades and export destinations differ meaningfully from Gulf barrels, and replacing the latter with the former is not a frictionless substitution. Refinery configurations, shipping logistics, and contract structures all matter — and in a genuine supply crisis, the transition costs are real. Some also point to a fatigue that has set into the market from being “whipsawed” by constantly shifting diplomatic signals, and that investors are finding it “incredibly hard” to get a handle on the ongoing price swings. This sounds less like a market that has found a structural equilibrium and more like one that is navigating genuine uncertainty one news cycle at a time.
Ultimately, as in the words of Seneca, time discovers truth. And whenever the next inevitable natural experiment to oil plays out, the next installment of Crude Situation will hope to weigh in .